 Contact
  Calendars
 Careers
 Engage
  District

Community Engagement | Background | Objectives | Timeline | FAQs | Resources | Staff Responses
In Spring 2020, APS invited community members to review data that will be used in the Fall 2020 Elementary School Boundary Process. This review of data by Planning Unit—the geographic building blocks APS uses to establish school attendance zones— will help ensure that the final data reflects what you know about your neighborhood, is accurate, complete and ready for use in adjusting boundaries across neighborhood elementary schools this fall.
Community Input in Data Review Process–New, Posted Sept. 2, 2020
The Fall 2020 Elementary School Boundary Process began with the Spring Data Review to help ensure that the data used for the fall 2020 boundary process reflects what the community knows about their neighborhoods, and is accurate, complete, and ready for use in adjusting boundaries across neighborhood elementary schools.
The Spring Data Review was a new phase introduced in response to feedback from the Arlington County Council of PTAs (CCPTA) after the 2018 elementary school boundary process. CCPTA recommended that APS allow more time for data review by the community, separate from a boundary adjustment process. In previous processes, the planning unit level data was introduced during the “Getting Started” phase, concurrently with the boundary scenarios, which did not provide enough time for staff to make revisions to the data based on community input.
Spring 2020 Data Review Community Engagement
In 2020, APS introduced the data review process ahead of developing boundary scenarios, providing more time for the community to focus exclusively on the data that will be used during the boundary adjustment process in the fall. Community members provided input to staff based on their knowledge of their neighborhoods. In addition, staff reviewed data and received input from representatives of 12 APS advisory committees and community leaders brought together during the Spring Data Review process for a Virtual Discussion with APS Advisory Committee and Community Leader representatives.
Community input came from virtual open office hours, community online information sessions and virtual discussions with APS advisory committees and community leader representatives, as well as a community questionnaire that was provided online and in paper in multiple languages. More than 650 people participated in the Spring Data Review Community Questionnaire.
Community Questionnaire
Total Responses: 656 (Multiple answers per participant possible; percentages added may exceed 100 since a participant may select more than one answer for this question.)
| Q: What is your relationship to APS? You may select more than one. | ||
| Responses | Percentage | |
| I am the Parent or Guardian of a current Elementary School Student in APS | 519 | 79% |
| I am the Parent or Guardian of a Child(ren) in PreK in APS | 48 | 7% |
| I am the Parent or Guardian of a Child(ren) not yet in PreK | 129 | 20% |
| I am the Parent or Guardian of a Middle or High School Student in APS | 147 | 22% |
| I am an APS Student | 1 | 0.10% |
| I am an APS Staff Member | 42 | 6% |
| I am an Arlington resident without school-age children | 22 | 3% |
| Other (Please specify) | 20 | 3% |
| (Did not answer) | 0 | 0% |
How Community Input was Used
After reviewing community input from the virtual meetings, questionnaire responses and Engage email, staff did the following (see each section below for details):
- Add more information resources to the Data Review Engage webpage (see section on Information Resources below)
- Applied a methodology approach for kindergarten projections
- Extend projections to include one additional year to 2024
- Work with Arlington County staff to review and verify questions and make some adjustments to data on housing developments
- Share input on walkability, walk zones and transportation with APS Director of Multimodal Transportation
- Review views and questions about the upcoming boundary process
Information Resources
In response to community input, staff added the following resources to the Data Review webpage:
- Updates to the Frequently Asked Questions (FAQs)
- Table of Kindergarten Students by Planning Unit 2017, 2018, 2019 (this should have details on the two methodologies.
- Superintendent’s 2020 Annual Update
- Map and table of Planning Units that intersect the 0.5-mile radius from the five options schools
- Staff responses to specific community member requests on the data
Methodology Approach
Why did we do this? Community members have shared that families who live closer to option schools are more likely to send their children to option schools. During this process we shared the data using that approach to gather input from the community. Out of the two methodology approaches considered for projecting Kindergarten students, Approach 2 will be used for projecting Kindergarten students, which takes into account the number of assumed option school students residing in Planning Units within 0.5-mile of such option schools and students residing in Planning Units beyond the 0.5-mile threshold of such option schools.
- Approach 2 is based on a planning unit’s half-mile proximity to an option school and the assumption that distance to the option schools impacts whether families enroll their students in the option school; the closer they live in an option school the more likely they are to enroll their child in an option school rather than their neighborhood school
- Staff did not have a preference on which approach to use. As part of the process of studying the difference between both approaches, staff looked at the 2023 Grades K to 5 enrollment in planning units within a half-mile of an option school. On average, this enrollment was lower by about 34 students in Approach 2, compared to Approach 1. This represents an average difference of just under 5%, which was not considered a sizable difference among planning units.
- Data Sources and Planning Unit Projections Assumptions and Methodology
Advisory members and community leaders shared their appreciation for the transparency of the data presented. The input received from members of APS advisory groups and community leaders included support for both of the methodology approaches. Questionnaire responses indicate that 35% of the respondents preferred approach 2 and that 44% did not have an opinion on a methodology.
| Q: Based on your understanding of the methodology (after careful review of the methodology document provided above), which projections approach do you think is preferable for APS to use when finalizing data before the Fall 2020 Elementary School Boundary process: | ||
| Responses | Percentage | |
| (Approach 1) Option program students are subtracted proportionally from each Planning Unit based on each PU’s expected total K population (including from new construction). | 115 | 17% |
| (Approach 2) Patterns for how many option school/program kindergarten students resided in PUs within 0.5-mile of an option school (41.6%) and how many resided in PUs beyond the 0.5-mile threshold (58.4%) were determined. | 228 | 35% |
| · These shares were then applied to the assumed future option school students. | ||
| · With these shares applied, the number of assumed option school students in PUs within 0.5-mile of such option schools were subtracted from each relevant PU based on its proportional kindergarten population size (including the estimated kindergarten students from new construction and reflects the school moves to take effect in 2021-22). | ||
| · Likewise, the number of assumed kindergarten students residing beyond the 0.5-mile threshold were subtracted proportionally based on each PU’s proportional kindergarten population (including the estimated kindergarten students from new construction). | ||
| I do not have an opinion | 286 | 44% |
| (Did not answer) | 27 | 4% |
| Total Responses | 656 | 100% |
Projections Extension
Staff incorporated input to extend the planning unit projections for this boundary process one extra year to 2024, which provides a longer-term view at the elementary school level.
- An initial run of the planning unit projections was for the years 2020 to 2023. Projecting out four years is done because the projections rely mostly on information from students who already attend APS as of September 30, 2019. For example, by projecting out four years, a current Grade 4 student will be in Grade 5 in 2020, a current Grade 3 student will be in Grade 4 in 2020, etc. In addition, in each projection year, assumptions must be made about incoming kindergarten students for 2020 through 2023; they are students who are not yet in the APS system.
- Upon request from members of the community, the planning unit elementary level projections will project out one extra year to 2024. The 2019 births that will inform the 2024 kindergarten students was forecasted by Arlington County government (ACG) and RLS Demographics, a consultant working with ACG on its Cohort Component Model to forecast births; this was provided to APS on September 30, 2019.
- Assumptions going out further than 2024 are fully based on assumptions about the future enrollment, such as future births. For example, the actual Kindergarten students in Sept. 30, 2019, will be in Grade 5 in 2024. But the K to Grade 4 cohorts in 2024 will be reliant on assumptions about future incoming kindergarten students from 2020 to 2024. By 2025, every single cohort, from kindergarten to Grade 5, will be based on assumptions about the future.
Housing Developments
Staff worked with ACG to verify the community’s input against approved housing developments in the county’s data. Where there were differences, further research was done to ensure that the information APS will use is accurate.
Summary of Revisions Made to Data Table:
- Queens Court
- applying a different Student Generation Factor (SGF) based on housing type: Countywide SGF for Committed Affordable (CAF) high rise will be applied
- change construction year to 2021, from 2022
- Apex East and West (formerly known as the Berkely) – Construction year changes from 2021 to 2020
- 1122 N Kirkwood Rd – Change total number of units to 270, from 255
- SP #447 (11th & Vermont) – Change to Mixed-Income
- Increase to 98 high rise units
- Lower to 10 town house units
- All units are net new
- 2309 North Tuckahoe Street – Net new two (2) Single Family Dwellings in 2021
- 6223 23rd Street North & 6229 23rd Street North – Net three (3) Single Family Dwellings in 2021
- 3865 North River Street – Net three (3) Single Family Dwellings in 2021
- 2711 1st Street South & 2707 1st Street South – Net two (2) Single Family Dwellings in 2021
- Planning unit 37010 was formerly noted as including the Arlington Forest Civic Association, this was incorrect and was updated
Walk Zone Information
Stakeholder input related to walkability and transportation was sent to the APS Director of Multimodal Transportation.
Fall 2020 Boundary Process
One of the questions in the community questionnaire looked ahead to the second part of the process for adjusting boundaries: Is there anything else related to the data in this review that you would like staff to know before the Fall 2020 boundary process? The responses included the following:
- Prioritizing walkability to neighborhood schools
- Maintaining school communities together
- Maintaining schools at, or under, building capacity
- Sharing that they want to better understand how their input is used in these APS processes
- Expressing appreciation for the opportunity to learn how the data is used in the process and to provide input on the data
- Understanding that change is necessary due to population growth
In the fall boundary process, scenario(s) will be accompanied by a summary by school addressing these community concerns.
Excel Spreadsheet of Questionnaire Responses
This link provides the spreadsheet with the 656 questionnaire responses by planning unit.
Final Planning Unit Data Table (Update Oct. 8, 2020)
Community Engagement
This questionnaire allows APS staff to gather community input from stakeholders based on their knowledge of their neighborhoods. Staff will review all input and make any necessary revisions to the Planning Unit data. A summary of community input and the final planning unit data will be posted on the APS Engage website in August 2020.
Community engagement opportunities are available from May 12 through June 5, 2020 (details below), with an online Community Questionnaire serving as the primary method for gathering input. APS strives to be transparent throughout this process and appreciates the input from community members who participate in this data review.In this data review process, APS asks community members to do the following:
- Review Planning Unit data using their knowledge of their neighborhoods (Planning Units are the geographic building blocks used to define attendance boundaries for neighborhood schools)
- Identify any items in a specific Planning Unit that APS should consider
- If stakeholders want to express a preference on methodology, consider the two alternative approaches that APS could use for the Planning Unit projections methodology and share input with staff
The following are the information resources for community members to review and share their input in this process:
- Final Planning Unit Data Table (Update Oct. 8, 2020) / Documento de Referencia para la Tabla de Datos
- Table 2 and 3. Housing Unit Forecast and Site Plan Approvals since Sept. 30, 2019 (Update 10.02.2020)
- Planning Unit Reference Map
- Planning Unit Elementary Enrollment Methodology / Metodología de Matrícula de las Escuelas Primarias por Unidades de Planificación
Community Engagement Activities
- April 14: Share data with members representing FAC and CCPTA
- April 22: Online session with FAC, CCPTA and other early reviewers
- May 12-June 5: Online community questionnaire – available in English and Spanish
- May 18 (12 p.m.): Facebook Live video in Spanish
- May 19 (7-8:30 p.m.): Community Online Information Session to share process, answer questions and gather input
- May 21: Monitoring Report to School Board
- May 28 (1-2 p.m.): Virtual Staff Open Office Hours to answer questions from community members
- May 28 (4:30 p.m.): Facebook Live video
- June 1: Virtual Discussion with APS Advisory Committee and Community Leader representatives
- June 5: Online community questionnaire closes and the engagement process ends
- July-August: Work with instructional leaders
- August: Community input will be shared online and final data table will be published
- August: Preliminary communications will begin on Phase 3, Fall 2020 ES Boundary Process
- Fall 2020: Elementary School Boundary Process
Background
As APS grows to 30,000 students in 2021, we are using a countywide approach to the Fall 2020 boundary process that takes the needs of all students into account. Elementary Planning for 2021 has four phases, with all changes taking effect in August 2021:
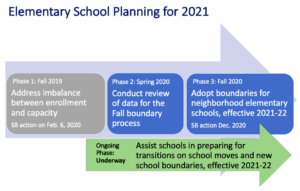
- In Spring 2020, APS is conducting the Phase 2 review of data for use in the Fall 2020 boundary process, with final data to be published in August 2020.
- This data review is an important first step for the boundary process. By sharing the data now and conducting this review early with stakeholders before developing boundary scenarios, staff can gather valuable input from residents who know their neighborhoods.
- The Planning Unit data in this review are based on a special enrollment projection done in early 2020, which is different from the 10-year enrollment projections released in Fall 2019.
- In Fall 2020, APS will implement the Phase 3 boundary process and adjust boundaries across elementary schools. This process will develop attendance zones for the new neighborhood elementary schools at the Key (2300 Key Blvd.) and Reed (1644 N. McKinley Rd.) sites, and a new neighborhood attendance zone around ASFS (1501 N. Lincoln St.), to take effect in August 2021
Data Review Objectives
This data review seeks to prepare APS for the Fall 2020 boundary process as follows:
- Be transparent in sharing Planning Unit data with the community as the first step in preparing for this boundary process
- Conduct a careful and critical examination with stakeholders of the Planning Unit data that will be used in this boundary process
- Review input received and ensure data is accurate, complete and ready to use for boundary adjustments
- Publish the final Planning Unit data in August 2020 that will be used in the fall boundary process (Phase 3)
Data Review Timeline
| February–April 2020 | Internal preparations for data review process |
| Late April | Share data table and gather feedback from early reviewers, including representatives from the Advisory Council on School Facilities and Capital Programs (FAC) and the County Council of PTAs (CCPTA) |
| May 12–June 5, 2020 | Community engagement for Phase 2 Data Review process, which includes community information sessions and a community questionnaire to gather community input related to Planning Unit data |
| June–August 2020 | Internal analysis of input and preparation with school administrators and internal cross-departmental team for the upcoming boundary process |
| August 2020 | Publish final Planning Unit data to be used in fall boundary process |
| Fall 2020 | Elementary School Boundary Process (Phase 3) |
Frequently Asked Questions
Planning Units
Q1: Will planning unit data be updated in the fall before/during phase 3 with sept 30th, 2020 enrollment info?
- A1: The Planning Unit projections for Grade K to 5 will not be updated in Fall 2020 with September 30, 2020 enrollment counts. The reason for this is timing: Phase 3, which will develop boundaries for neighborhood elementary schools for 2021-22, needs to start in Fall 2020 and updating projections will delay that process. In addition, in Fall 2020, the staff that works on enrollment projections will be focused on producing a new round of 10-year enrollment projections which will use September 30, 2020 enrollment.
Q2: Will planning unit splits be considered?
- Splitting planning units is not a part of this process at this time. The only planning unit split we may consider would be for single new development. We plan to review planning units in about two years; following a five-year cycle.
Projections Methodology
Q1: What is assumed for the number of Kindergarten students that will not attend their neighborhood school and attend an option school/program?
- A1: The Spring 2020 planning unit projections assume that 506 Kindergarten students will attend an elementary option school/program in each of the years between 2020-21 to 2023-24. These 506 Kindergarten students are not counted among the Grade K students that are projected to attend their neighborhood school in those years. The assumption of 506 Kindergarten students who attend option schools/programs, references the “Spring 1-Year Projections Update for the 2020-21 School Year” document that can be found at this link, https://www.apsva.us/wp-content/uploads/2020/03/2020-03-19-Spring-Update-2020-21_for_website.pdf. The 2020-21 Spring Update, which is used for staffing and budgeting purposes for each school and program, estimates the following number of Kindergarten students at following schools: Arlington Traditional with 96 K students, Campbell with 72 K students, Claremont with 144 K students, Key with 144 K students, and the Montessori Public School of Arlington with 50 K students.
Q2: Why does the data only go to 2024? What not look at data through 2025 or 2026?
- A2: An initial run of the planning unit projections was for the years 2020 to 2023. The reason for projecting out four years was because in this approach, the projections rely mostly on information from students that already attend APS as of September 30, 2019. For example, by projecting out four years a current Grade 4 student will be in Grade 5 in 2020, a current Grade 3 student will be in Grade 4 in 2020, etc. In addition, in each projection year, assumptions must be made about future incoming kindergarten students for 2020 through 2023; they are students not in the APS system yet. A benefit of projecting out four years is that APS does have live birth records, courtesy of ACG, for the years 2015 to 2018. A certain percentage of 2015 births will enroll as APS kindergarten students in 2020, a percentage of 2016 births will be future kindergarteners in 2021, a percentage of 2017 births will be future kindergarteners in 2022, and a percentage of 2018 births will be future kindergarteners in 2023. As of May 7, 2020, neither ACG or The Virginia Department of Health’s Division of Health Statistics have the number of actual births for Arlington County parents that occurred in 2019. Upon request from Advisory Council on School Facilities and Capital Programs (FAC) and other members of the community, the planning unit elementary projections will project out one extra year to 2024. The 2019 births that will inform the 2024 kindergarten students was forecasted by ACG and RLS Demographics, a consultant who has worked with ACG on its Cohort Component Model to forecast births, and provided to APS on September 30, 2019. Assumptions going out further than 2024 provide uncertainty with the data.
Q3: For planning units with a large number of military families, numbers of enrolled kids change based on the movement of those families. Have you looked at enrollment projections for schools that have mobile populations and factored that into the equation for neighborhood school boundaries?
- A3: Military participation is not a required question upon registration and APS does not have consistent information on military participation from our families. We do calculate cohort transition rates, K to 5: To “age” students from one grade to another—from one year to the next year—a three-year average county-wide cohort transition rate was calculated for Grades K to 1, 1 to 2, 2 to 3, 3 to 4, and 4 to 5. The three-year average used historical Sept. 30 enrollment from 2017, 2018, and 2019. These rates were applied to elementary cohorts at the planning unit level as they “age” to the next grade in the next school year.
Q4: Is there a big difference in the number of students using the different methodology approaches?
- A4: There are slight differences – see columns A-K in the Planning Unit Data Table. APS staff is asking the community to weigh in on which methodology approach is more reasonable. The Planning Unit Data Table has elementary projections in which Kindergarten students likely to attend their neighborhood school were calculated according to a planning unit’s relative kindergarten population size (Approach 1–similar to the 2018 approach); OR based on a planning unit’s half mile proximity to an option school (Approach 2). Note that Approach 2 takes into consideration the fact that two option/school programs will relocate, thus planning units close to the relocated Immersion and Arlington Traditional elementary schools will have higher percentages of kindergarten students attending an option school.
- A4: Background: In the Fall 2018 elementary school boundary process, the community and decision makers questioned the approach of estimating the number of kindergarten students who would attend an option school based on the planning unit’s relative population size (approach 1). The rationale for questioning this approach is that it did not account for the influence an option school’s location is likely to have on a parent’s decision to enroll their child in an option school. For example, it was asserted that a parent is more likely to enroll their kindergarten student in an option school if they live close to that option school. By extension, the percentage of kindergarten student’s likely to attend their neighborhood school should be lower for planning units that are in proximity to an option school, since a high percentage of kindergarten students are enrolled in an option school. In order to address these concerns expressed in 2018 regarding the estimation of future kindergarten students by planning units likely to attend their neighborhood school, In order to address these concerns expressed in 2018 regarding approach 1, we are asking the community to weigh in on which approach is more reasonable.
Housing
Q1: Where does your housing information come from, and why are you asking the community to verify it?
- A1: See “Data Sources” on pg. 2 of methodology document. Housing Unit Forecast from Arlington County Government (ACG) from September 2019 and updated with ACG residential construction status information from March 2020, see Table 2 and 3. Housing Unit Forecast and Site Plan Approvals since Sept. 30, 2019 (Update 10.02.2020). This data includes a timeline of when residential construction projects are forecasted by ACG to be completed and habitable, each project’s residential type, number of net new units, and affordability levels. This information helps APS estimate the number of new students and the year that a given housing development will add students to neighborhood schools.
- We work closely with the ACG for any updates to the data provided. We appreciate the community looking at it closely as community members know their neighborhoods best and know quite a bit about development happening in their neighborhoods. We appreciate a second look.
Q2: Are the Student Generation Rates updated annually? How are they calculated for different types of housing?
- A2: The student generation rates are calculated each year and use a yearly updated housing unit snapshot made possible to APS through a data-sharing agreement with Arlington County Government (ACG). Each year APS matches the most current September 30 student enrollment counts by address to the yearly updated housing inventory in the County from ACG. The yearly updated housing snapshot, known as Master Housing Unit Database (MHUD) includes housing type, number of units, details on the number of Committed Affordable Units (CAFs), and affordability classification for each complex (CAF only, Market Rate, or Mixed), and the presence of an approved Accessory Dwelling Unit (ADU) on a residential parcel. The Student Generation Rate is the mathematical representation of the relationship between the number of existing housing units in Arlington County and the number of students—by housing unit type and affordability designation—enrolled at APS on September 30 for a given year. This rate is calculated for every neighborhood school boundary at the elementary, middle, and high school levels. A copy of the Students Generation Rate tables for Fall 2019, 2018, and 2017 can be found at these links:
- Fall 2019, https://www.apsva.us/wp-content/uploads/2019/12/2019-Report-Final.pdf (see Attachment C)
- Fall 2018, https://www.apsva.us/wp-content/uploads/2019/02/Fall-2019-28-APS-Enrollment-Report_v12_.pdf (see page 35)
- Fall 2017, https://www.apsva.us/wp-content/uploads/2018/09/SGF-2017-18_by_School_Web_Final.pdf
Q3: How are the Student Generation Rates applied?
- A3: When the ACG staff provides the housing unit forecast, each forecasted residential development is matched to its corresponding planning unit, neighborhood elementary boundary, neighborhood middle school boundary, and neighborhood high school boundary. With the neighborhood boundary information known and the housing development type (townhouse or garden for example) and affordability level (market-rate, mixed-income, or all affordable) from ACG noted, the Student Generation Rate table is used, see https://www.apsva.us/wp-content/uploads/2019/12/2019-Report-Final.pdf (see Attachment C). The relevant neighborhood boundary, housing type, and affordability level are cross-referenced on a table to get each housing project’s unique Student Generation Rate. For example, if a housing project is in the (a) Barrett Elementary boundary, the housing type of the project is (b) Garden multi-family, and the housing project’s affordability level is (c) mixed-income, then relevant student generation on the table (see Attachment C) will be 0.278. If, for example, a neighborhood boundary does not have a housing type Student Generation Rate, then the default is to use the county-wide student generation rate for that housing type and affordability-level.
Q4: How will you use the community’s input from the questionnaire that identifies some difference in reported development projects?
- A4: APS staff will verify the community’s input against developments in ACG’s data. Where there are differences, we’ll do further work to make sure our information is the most accurate. Final data will reflect identified and verified changes.
Staff Responses to Inquiries Received from Community Members.pdf
Resources
Table of Kindergarten Students by Planning Unit 2017, 2018, 2019
Superintendent’s 2020 Annual Update
Planning Units Intersect Half Mile Radius From Option School Map | Planning Units Half Mile of Option School Excel Spreadsheet